
How to Read the BTC Trend Timeline in GT App
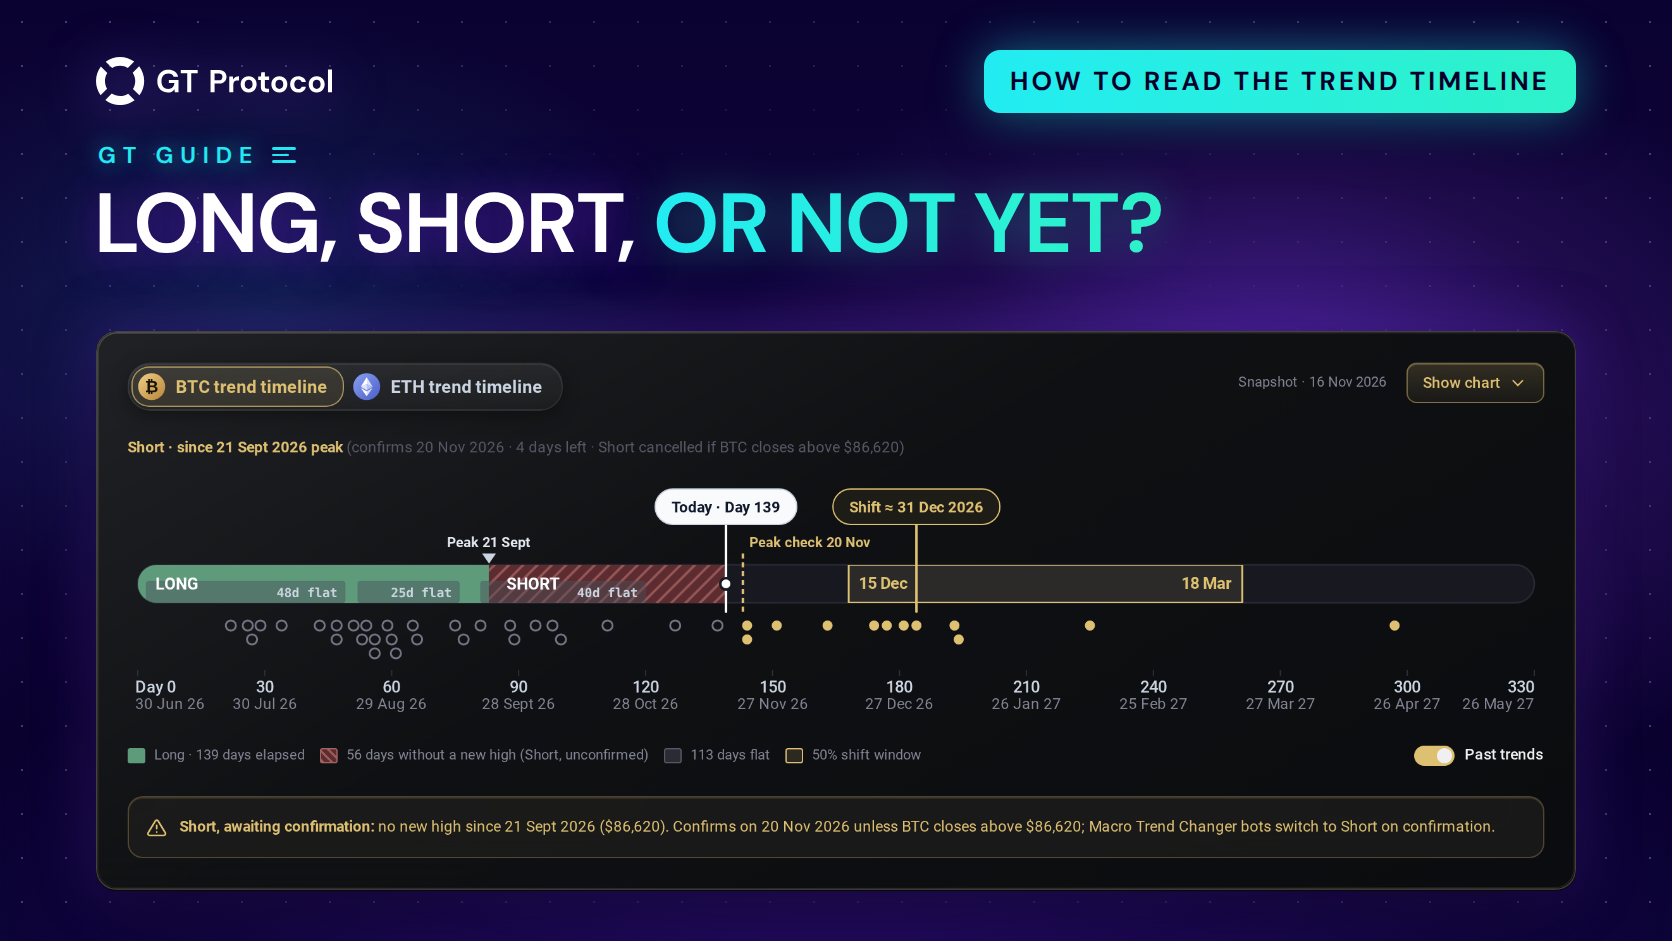
The trend timeline on the TOP Traders page of GT App shows Bitcoin’s macro trend as one bar: which way the market has been going for months, how long that has lasted, whether a reversal is forming, the date it would be confirmed and the price that would cancel it. An ETH tab does the same for Ethereum.
This guide goes through the card line by line, from the status line to the chart behind Show chart, and then what it means for a strategy that uses Macro Trend Changer. It describes the app as of November 2026. The card reads history and doesn’t forecast, and this guide won’t tell you which way to trade.
Table of contents
- Where do you find the trend timeline in GT App?
- Which trend does the card show?
- What does the status line tell you?
- How do you read the bar?
- What do the grey flat periods mean?
- What are the gold window and the Shift date?
- What do the dots under the bar show?
- What is behind Show chart?
- How is the ETH timeline different?
- What does the timeline mean for your strategy?
- Frequently asked questions
Where do you find the trend timeline in GT App?
Open TOP Traders, the first item under Trading in the app’s menu. The card sits under the banners, above the list of top strategies, and you can see it before you sign in.
At the top of the card are two tabs, BTC trend timeline and ETH trend timeline (on a phone they read BTC and ETH). The app remembers the tab you picked on that device. The snapshot date sits at the top right, or under the status line on a phone, for example “Snapshot · 16 Nov 2026”. The card is built from daily closing prices, and that date is the last day it includes. If the data is more than three days old, the card says it may be out of date and offers a Refresh button.
On a phone the timeline is wider than the screen, so swipe it sideways to see the right end.
Which trend does the card show?
The card follows the confirmed trend: the direction Macro Trend Changer acts on. The colour of the bar, the word LONG or SHORT at its start and the day count all belong to it.
A reversal that has started but isn’t confirmed yet doesn’t repaint the card. It shows up in three places: the status line, hatching on the bar and a note under the timeline. It stays there until it is either confirmed or cancelled.
That is why the card can look like it says two things at once. On the snapshot of 16 November 2026, Bitcoin’s confirmed trend was Long, counted from the low of 30 June and confirmed on 29 August. Bitcoin hadn’t made a new high since 21 September, so a Short was forming against it. The bar was green and began with LONG, while the status line above it talked about a Short.
What does the status line tell you?
The line under the tabs takes one of two forms. The first is what the card showed on 16 November; the second is how it reads when no reversal is forming, here with the same Long trend:
| Status line | What it means |
|---|---|
| Short · since 21 Sept 2026 peak (confirms 20 Nov 2026 · 4 days left · Short cancelled if BTC closes above $86,620) | A reversal to Short is forming. It counts from the high of 21 September, becomes confirmed on 20 November, and is called off if Bitcoin closes above that high first |
| Long · since 30 Jun 2026 trough · confirmed 29 Aug 2026 | No reversal is forming. The trend is Long, counted from the low of 30 June, and was confirmed on 29 August |
The first form reads in three steps:
- Since … peak is where the forming trend begins: the highest close before the fall. For a forming Long it says trough, the lowest close before the rise.
- Confirms … · N days left is the date the reversal becomes confirmed if nothing changes, and how many days remain from the snapshot date.
- Cancelled if BTC closes above … is the price that calls the reversal off. It is the close of that high, and it takes a daily close above it, not a brief spike during the day. For a forming Long, the condition is a close below the trough.
A Short is printed in gold, whether it is forming or confirmed; a Long line stays plain.
How do you read the bar?
The bar is the current trend laid out in days. Day 0 is its first day, and the scale underneath counts days and gives the matching dates.
- The solid colour, green for Long and red for Short, runs from Day 0 to the trend’s latest high (or low, in a Short).
- The hatching after it covers the days since then without a new high. The legend counts them and names the reversal they point to, for example “56 days without a new high (Short, unconfirmed)”.
- The small triangle marks that latest high, labelled with its date (“Peak 21 Sept”). In a Short it marks the latest low and says Trough.
- The dotted line is the check date (“Peak check 20 Nov”): the day the reversal is confirmed if no new high comes before it.
- The white pill, “Today · Day 139”, is where the snapshot stands.
Hover over the bar, or tap it on a phone, to see the date and day number under your finger and what that day is: elapsed, today, or a number of days after the snapshot.
When a reversal is confirmed, the card turns to the new trend. The bar takes its colour, the status line switches to the second form with the confirmation date, and the note under the timeline says that Macro Trend Changer has switched.
What do the grey flat periods mean?
The grey pills along the bottom edge of the bar mark flat periods: stretches when the daily closes stayed inside a narrow price range and the trend made no real progress. A caption such as “48d flat” gives the length in days, both ends included, and the legend adds them up.
The 16 November example shows why this matters. Bitcoin’s Long had run for 139 days, and the legend said “113 days flat”: three sideways stretches of 48, 25 and 40 days. For most of the trend the price moved sideways. The word Long describes the big picture; the grey pills show how much of that time the price spent going nowhere.
On narrow screens a caption is left out when it doesn’t fit its pill. Hover over or tap the pill to see its length and dates.
What are the gold window and the Shift date?
The gold band on the bar, “50% shift window” in the legend, and the gold pill above it, “Shift ≈ 31 Dec 2026” in our example, are an estimate drawn from how long past trends lasted. If the current trend keeps going, the middle half of the estimated dates for a change falls inside the band, and the pill marks the middle date. In the example the band ran from 15 December 2026 to 18 March 2027. The tooltip on the band says what it rests on: “Conditional on the trend continuing”.
Read it as a range from history, not a date to plan around. Past trends varied a lot in length, as the dots under the bar show, and a reversal that is already forming can end the trend well before the window. When a new trend is confirmed, the card draws a new window for it.
What do the dots under the bar show?
With Past trends switched on, every earlier trend appears as a dot placed at its length in days, on the same scale as the bar. Hollow dots are trends that had already ended by the day count the current trend has reached. Gold dots are earlier trends that lasted longer than the current one has so far.
Hover over or tap a dot to see whether it was an uptrend or a downtrend, its dates, its length and how much the price changed over it. On 16 November most of the dots lay to the left of Today: most earlier Bitcoin trends had ended sooner than 139 days. That doesn’t say when this one ends; it shows how its age compares with the past.
What is behind Show chart?
Show chart opens Bitcoin’s price coloured by trend direction, over 1 year, 3 years, since 2017 or all history. Reversal points are marked with their dates, and one that isn’t confirmed yet carries a question mark. Grey boxes are the flat ranges, with their length in days.
The chart draws the trend as it stands on the snapshot day, including a reversal that isn’t confirmed yet, while the bar above follows the confirmed trend. So the chart can already be red where the bar is still green.
Chart layers turns parts of the chart on and off:
- Price trend line
- Flat ranges
- Ladder trades (▲ Buy / ▼ Sell)
- 50% Shift & Trough forecast
- Sell / Buy zones & Invalidation
- Days & BTC % sub-charts
Ladder trades and the BTC % sub-chart show how a rule based on trend timing would have scaled in and out of Bitcoin in the past; the forecast, zones and levels are model estimates. The card itself says so under the chart: they are “model estimates for information only, not a recommendation to buy or sell”. We read them the same way, as statistics, not instructions.
How is the ETH timeline different?
The ETH tab draws the same card from Ethereum’s own daily closes. The one thing it doesn’t do is switch strategies:
| BTC timeline | ETH timeline | |
|---|---|---|
| Reads | Bitcoin’s macro trend | Ethereum’s macro trend |
| Macro Trend Changer | Switches strategies on it | Doesn’t switch strategies |
| 16 Nov 2026 | Long since 30 June, Short forming since 21 September, cancel level $86,620 | Long since 25 June, Short forming since 21 September, cancel level $2,776 |
Macro Trend Changer follows Bitcoin’s confirmed trend for every strategy, whatever coin it trades. The ETH timeline is there to read Ethereum’s trend next to Bitcoin’s.
What does the timeline mean for your strategy?
The card changes nothing by itself. Strategies react to it only through Macro Trend Changer, a setting in the strategy form with three modes: Notification sends an alert, Direction auto switch turns the strategy’s direction from the next deal, and Immediate switch turns it at once and stops the open deal. Once a reversal on the BTC timeline is confirmed, running strategies with an automatic mode switch to the new direction, and Notification only alerts you. Turning the setting on doesn’t move a strategy to the current trend; it waits for the next confirmed change. New in GT App: Macro Trend Changer Reads Bitcoin’s Trend covers the modes in full.
So the status line is worth a look before you launch or change a strategy:
- A reversal is forming and the check date is close. If your strategies use Macro Trend Changer in an automatic mode, you know when they may switch, and which close would stop it.
- You are picking a direction for a new strategy. The card shows which way Bitcoin’s big trend points and how old it is. Many coins move with Bitcoin, though not all equally, and the choice stays yours. Long or Short: Choosing a Trading Bot’s Direction in GT App goes through it.
- You want to see how a switch behaves. A demo strategy runs on live prices without money; What Are Demo Long and Demo Short in GT App? explains how demo strategies work.
What the timeline doesn’t do:
- It doesn’t forecast. A trend is confirmed after it has started, and the window is a range from history.
- A forming reversal isn’t a signal yet. One daily close beyond its level cancels it; a move inside the day counts only once the day closes.
- It doesn’t replace a stop loss. Months can pass between two confirmed changes; How to Set a Stop Loss on a Trading Bot in GT App covers what limits a single deal.
Frequently asked questions
Is the trend timeline a forecast?
No. The trend, the forming reversal and the flat periods come from prices that have already closed. The gold window and the forecast layers of the chart are estimates from the lengths and sizes of past trends, and the card labels them as model estimates, not recommendations.
Why does the bar say LONG while the status line talks about a Short?
The bar follows the confirmed trend. The status line also shows a reversal that is forming against it but isn’t confirmed yet. Once that reversal is confirmed, the bar turns too; if it is cancelled, the status line goes back to the confirmed trend.
How often does the card change?
It is built from daily closing prices, so the picture moves once a day. The snapshot date at the top tells you which day’s close it includes, and the card warns you when the data is more than three days old.
Does Macro Trend Changer follow the ETH timeline?
No. Macro Trend Changer switches strategies on Bitcoin’s confirmed trend only, whichever coin they trade. The ETH tab shows Ethereum’s trend for reading.
Do I need a GT App account to see the card?
No. The TOP Traders page shows it before you sign in. You need an account to create a strategy and turn on Macro Trend Changer.
Can a confirmed trend change again soon after?
Yes. Confirmation makes false alarms rarer, not impossible, and in a market that keeps changing direction one confirmed change can be followed by another. That is one reason the timeline is a reading aid, not a trading plan.
Is this article investment advice?
No. It is published by GT Research for information. GT Protocol provides software, not financial, investment, tax or legal advice. The dates and prices quoted come from one snapshot of the card and only show how to read it; they are not recommendations or forecasts, and every trading decision is the reader’s own.
Where to start
Open TOP Traders in GT App and read the status line first: is a reversal forming, when would it be confirmed, and what would cancel it? Then look at the bar for the trend’s age and its flat periods, switch on Past trends to compare that age with history, and open Show chart if you want the price behind it. If your strategies use Macro Trend Changer, note the check date. If you are new to the app, Four Steps from Sign-Up to Real-Money Trading in GT App shows where strategies come in.
This article is published by GT Research for information. It describes the trend timeline card in GT App as of November 2026, and it is not financial advice. The examples quote one snapshot of the card, dated 16 November 2026; the card changes as new daily closes arrive. The trend, the shift window and the price levels on the card are model estimates drawn from past prices, and nothing here is a prediction or a promise of returns. Trading digital assets carries a risk of losing some or all of the funds committed. GT Protocol provides software, not financial, investment, tax or legal advice, and GT App is not available in every jurisdiction; the Terms of Service list the restrictions.