
Bitcoin Options Expiry: Does Max Pain Really Move the Price?
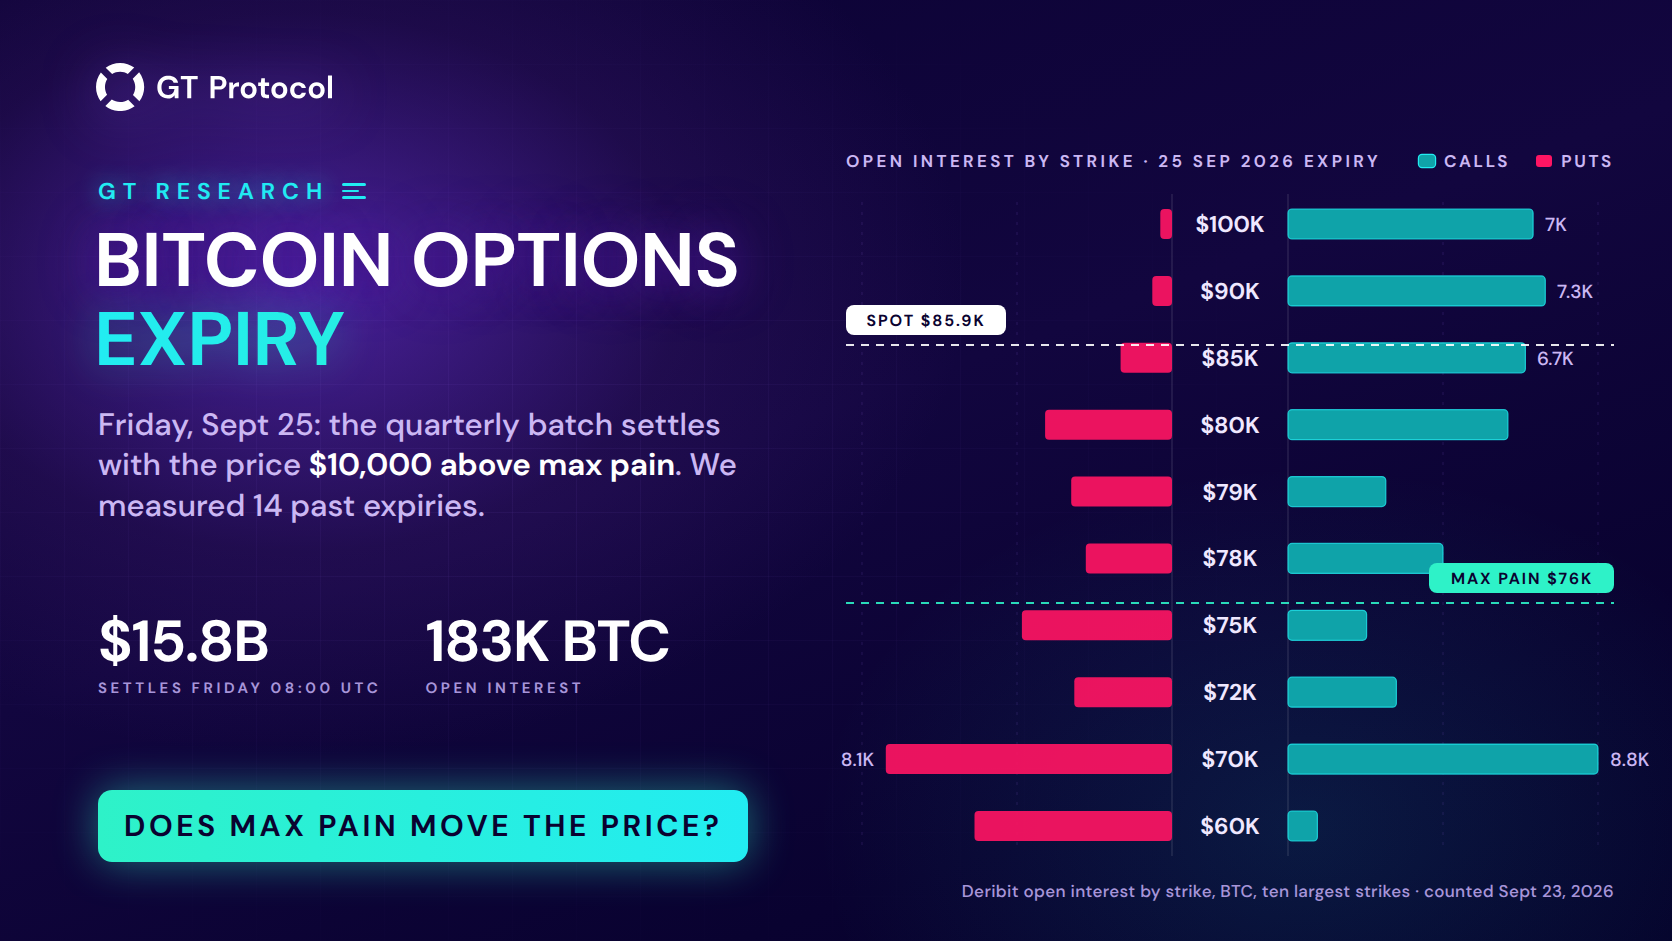
A bitcoin options expiry is the moment a batch of option contracts stops trading and is settled in cash. On Friday, September 25, about $15.8 billion settle on Deribit at 08:00 UTC, with the price about $10,000 above the expiry’s max pain level. We measured the last 14 quarterly expiries, and they moved the price less than the folklore says.
This guide covers what settles at expiry and how, what max pain is and what it can and cannot do, what bitcoin actually did around the last 14 quarterly expiries, and how we configure a bot in GT App for a week like this one. The figures were taken on the morning of September 23, 2026 (UTC). The expiry is a snapshot; the method is not.
Table of contents
- What happens when bitcoin options expire?
- What is max pain, and does it pull the price?
- How much does bitcoin move around a quarterly expiry?
- What does the rally into this expiry change?
- How do we run a trading bot through expiry week?
- What mistakes do traders make around options expiry?
- Frequently asked questions
What happens when bitcoin options expire?
A bitcoin options expiry is the scheduled moment when a batch of option contracts stops trading and is settled. On Deribit, the exchange our figures come from, contracts expire at 08:00 UTC, and the settlement price is not the last trade but the time-weighted average of the exchange’s bitcoin index over the final 30 minutes, from 07:30 to 08:00. An option that finishes in the money is exercised automatically and pays out the difference in cash; one that finishes out of the money expires worthless. Contracts come in daily, weekly, monthly and quarterly series, and the quarterly ones, expiring on the last Friday of March, June, September and December, carry the most open interest, because that is where longer-dated positions accumulate. The batch expiring on September 25, 2026 held 183,253 BTC of open interest on the morning of September 23, about $15.8 billion at the index price of $85,945, or 37% of every bitcoin option open on the exchange. Ether adds 777,969 ETH, about $2.1 billion.
Open interest is the number of contracts still open, the figure the headlines quote. It says nothing about who is long and who is short, or how many contracts are one leg of a spread that cancels out. Of the 183,253 BTC, 107,844 are calls and 75,408 are puts, a put/call ratio of 0.70. The largest single strike is $70,000, with 8,792 BTC of calls and 8,116 of puts, then $80,000 and $85,000, and above the market the calls stacked at $90,000 and $100,000 with almost no puts against them. Once the settlement price is fixed, all of it leaves the book at once.
What is max pain, and does it pull the price?
Max pain is the settlement price at which the open options of one expiry would pay out the least in total, which means option buyers as a group would lose the most and option sellers would keep the most premium. It is arithmetic, not a forecast: take every open call and put, work out what each would be worth at a given settlement price, add it up, and find the price where the sum is smallest. For the September 25 expiry that price is $76,000 by our count, while bitcoin traded at $85,945 when we ran the numbers. The popular theory says the price gets pulled toward max pain as expiry nears, because the dealers who sold the options hedge them in the spot and futures markets and unwind those hedges into settlement. Our reading is that the hedging flows exist, but they are small next to everything else that moves bitcoin, and this week is a good illustration.
For the settlement price to land on max pain, bitcoin would have to fall 11.6% between the morning of September 23 and Friday 08:00 UTC. In the 14 quarterly expiries we measured, the largest move in the 24 hours before settlement was 3.4%. At $86,000, 96% of the puts in this expiry are out of the money and expire worthless unless the market turns, while 53% of the calls are in the money. The strike map records where positions were built, not where the price is going.
What we cannot do is test the pull itself, because open interest by strike for past expiries is not something we store. What we can test is whether expiry days behave differently from ordinary days, and that is the next section.
How much does bitcoin move around a quarterly expiry?
We measured bitcoin’s price on Binance around the last 14 quarterly expiries, from March 2023 to June 2026, using the 08:00 UTC settlement as the anchor. The day before settlement moved the price by a median of 2.2% in one direction or the other, about twice the median move of an ordinary day in the same period (1.2%), but its high-to-low range was ordinary: 3.2% against 3.1% for a typical day. The 24 hours after settlement were quieter, a median move of 0.8%. The settlement hour itself, 08:00 to 09:00 UTC, ranged 0.58% at the median against 0.45% for the same hour on other days, with the widest reading, 1.5%, in March 2026. Direction was a coin toss: the day before ended lower in 9 of 14 cases, the day after in 8 of 14, and the following week finished higher in 8 of 14. Fourteen is a small sample, and we treat it as one.
| Measure | Expiry day | Ordinary day |
|---|---|---|
| Price move in the 24 h before settlement | 2.2% (largest 3.4%) | 1.2% |
| High-to-low range of those 24 h | 3.2% (from 1.6% to 6.6%) | 3.1% |
| Price move in the 24 h after settlement | 0.8% (largest 2.9%) | 1.2% |
| Range of the settlement hour, 08:00 to 09:00 UTC | 0.58% (widest 1.5%) | 0.45% |
| Direction of the day before | lower in 9 of 14 | no pattern to compare |
| Week after settlement | +0.4%, higher in 8 of 14 (from -11.3% to +9.4%) | no pattern to compare |
Our measurement on Binance BTC/USDT hourly and daily candles. Expiry day: the median of the 14 quarterly expiries from March 31, 2023 to June 26, 2026, with the extremes in brackets; ordinary day: the median over every day in the same span.
Two things follow. In this sample a quarterly expiry was not a cliff: the widest day-before range in three and a half years, 6.6% in June 2026, is the kind of day bitcoin produces several times a quarter with no expiry attached. And direction cannot be read off the calendar: the two moves that stand out, an 11.3% drop in the week after the June 2024 expiry and a 9.4% rise after September 2025, belonged to the trends of those months, not to anything that happened at 08:00 on the Friday.
What does the rally into this expiry change?
This expiry arrives after a 14.6% rise in eight days. From the September 15 low of $74,968, the day the Senate vote on the CLARITY Act failed, to the morning of September 23, bitcoin rose to about $85,900, with two large days inside the move: 5.8% on September 18 and 6.7% on September 21, when the price touched $87,396, its highest since January 29. The week ending September 20 closed at $81,178, above the 50-week moving average of $78,821 for the first time since the week of November 3, 2025, after 44 weeks below it. Crypto press attributed the move to four days of falling oil prices, spot-ETF flows turning positive and roughly $650 million of short positions liquidated within a day, citing CoinGlass; corporate treasury purchases were named as well. We do not claim to know which of these mattered most. What we can measure is how the market is positioned.
Funding on Binance perpetual futures, the fee that longs pay shorts every eight hours when the market leans long, printed between 0.0003% and 0.010% from September 20 to 23, at or below its 0.01% baseline, with open interest of about 106,000 BTC. That is not the profile of a market leaning heavily long on borrowed money. The options market prices bitcoin’s 30-day implied volatility, Deribit’s DVOL index, at 37.9, inside the 33 to 47 range it has held for five weeks, which works out to a one-standard-deviation daily move of about 2%. In plain words, option prices correspond to a typical daily move of about 2%, with no extra premium attached to Friday.
The road here is covered in our note on the short squeeze above $70,000 in August and in our two pieces on the CLARITY Act vote.
How do we run a trading bot through expiry week?
We run bots through expiry week the way we run them through any other week, with one extra check: the configuration has to survive the widest expiry-day range we have measured, 6.6%, without anyone at the keyboard at 08:00 UTC on Friday. The calendar is public, so the event is never a surprise, and our numbers say the surprise was usually small. The risk sits elsewhere: in leverage sized for the quiet days that preceded the week, in a safety-order ladder that stops one step short of the range, and in the urge to do something because a large number is in the headlines. A bot is only as calm as its settings, and settings are decided before the week starts, not at 07:55 on Friday. This is the checklist we go through in GT App, in order.
- Know what the bot actually holds. A spot bot owns coins: no expiry, no funding, no liquidation, and the only thing Friday can do to it is move the price. A futures bot on Binance or Hyperliquid holds perpetual contracts, which have no expiry of their own; Deribit’s settlement does not touch them directly, only through the price. Spot vs futures vs perps explains the mechanics.
- Size leverage to the measured range, not to last week. At 10x, a 6.6% adverse move consumes two-thirds of the margin; at 15x it consumes all of it. We run futures bots in isolated margin with an explicit budget per bot, so the worst case is a number chosen in advance. Isolated vs cross margin has the arithmetic.
- Check that the safety-order ladder covers the range with room to spare. A ladder built to survive a 20 to 30% adverse move, the starting point in our safety-orders guide, has a 6.6% day well inside it. What fails is a ladder shortened to catch a dip, or a martingale multiplier that turns the fourth step into the largest position of the week.
- Decide the exit before the move. A week that keeps trending is the easy case for a take-profit order. The case to prepare for is a deal that runs most of the way to its target and rolls back; for that we switch on Smart Exit, which can close a deal that is already in profit, between 60% and 95% of the way to take-profit, when reversal signals appear, and does not act on a losing deal.
- Watch funding, not the options chain. For a perpetual position the cost that compounds is funding, and it is printed on the exchange where the position lives. This week it sits at its baseline; a strongly positive print would be our signal to trim leverage on longs, long before any expiry date would.
- Do not trade the clock. We do not stop bots for the settlement hour and do not open new ones because a headline calls the expiry bullish or bearish. Our measurement gives the settlement hour a median range of 0.58%; a strategy that cannot be left alone for one hour a quarter is mis-sized, not mis-timed.
- Rehearse on history first. GT AI Backtest holds about a year of minute data per pair, which covers the last three quarterly expiries and the weeks around them. Run the strategy with fees and slippage switched on, read the deal list around those dates, then let a demo bot with the same settings run the current week. Backtesting vs paper trading explains what each test proves.
What mistakes do traders make around options expiry?
The most common mistake is to read max pain as a target. It is the level where option buyers lose the most, and the market is under no obligation to go there: this week it sits 11.6% below the price two days before settlement, further than any 24-hour move in our sample. The second is to read open interest as a forecast. A large stack of calls at $100,000 says that positions exist at that strike; it does not say whether they were bought as bets or sold to fund something else, and dealers hedge both sides. The third is to trade the calendar with the wrong instrument: watching an options expiry on one exchange while holding perpetuals on another, where funding and the liquidation price matter far more than Friday’s settlement. The fourth is activity for its own sake, closing and reopening positions around 08:00 UTC and paying the spread twice to sit out an hour that ranges 0.6%.
Two smaller habits cost money as well: treating the put/call ratio as sentiment, when it counts contracts including the hedges and spreads that cancel each other out, and sizing for the settlement while forgetting the rally. A 14.6% move in eight days is the risk a bot has to be built for; the half hour on Friday is not.
Frequently asked questions
When do bitcoin options expire?
On Deribit, at 08:00 UTC. Daily contracts expire on their date, weekly contracts on Fridays, and monthly and quarterly contracts on the last Friday of the month, with the quarterly series at the end of March, June, September and December. The settlement price is the time-weighted average of the exchange’s bitcoin index over the last 30 minutes before 08:00.
What is max pain in bitcoin options?
Max pain is the settlement price at which all open options of one expiry would pay out the least in total. It is calculated from open interest at each strike, so it moves as positions open and close. For the September 25, 2026 expiry it was $76,000 on the morning of September 23, by our count from Deribit’s public data, against a bitcoin price of $85,945.
Does bitcoin always fall at options expiry?
No. In the 14 quarterly expiries we measured since 2023, the day before settlement closed lower in 9 cases and the day after in 8; the following week was higher in 8. The median move on the day before was 2.2% in either direction. In our sample, expiry days were ordinary days with a headline attached.
Does a Deribit expiry affect perpetual futures on Binance or Hyperliquid?
Not directly. Perpetual contracts have no expiry of their own and settle nothing on Friday. What reaches them is the price, and whatever hedging flow the expiry adds to it. For a perpetual position the numbers that matter are funding and the liquidation price, both visible on the exchange where the position lives.
Should I pause my trading bot on expiry day?
We do not. Our measurement gives the settlement hour a median range of 0.58% and the day before a range of 3.2%, in line with an ordinary day. So the settings that decide the outcome are the same ones that decide it every week: the leverage and the safety-order ladder, not the calendar. Switching a bot off with an open deal removes the manager and keeps the risk.
Is this article investment advice?
No. It is published by GT Research for information. GT Protocol provides software, not financial, investment, tax or legal advice. The measurements describe past expiries and say nothing about the next one, and any settings mentioned are examples of how the tools work, not recommendations.
Where to start
Take the strategy you already run, or build one in GT AI Backtest with fees and slippage switched on, and read its deals around the last three quarterly expiries: December 26, 2025, March 27 and June 26, 2026. If the ladder and the leverage survive those weeks on history, start the same settings as a demo bot in GT App and let Friday pass on its own. The settlement takes half an hour; the week around it is what the bot has to be sized for.
This article is published by GT Research for information. It is not financial advice, and nothing here is a prediction or a promise of returns. The measurements describe past expiries; future ones can differ. Trading digital assets, and futures in particular, carries a risk of losing some or all of the funds committed. GT Protocol provides software, not financial, investment, tax or legal advice. GT App is not available in every jurisdiction; the Terms of Service list the restrictions.